v2 — the conviction upgrade. Every regime shift is now graded PRIME ★, STRONG ●, or WEAK ○ by a 6-component confluence score — Kaufman ER, volume burst, HMA cloud direction, RSI thrust, MACD acceleration, and VWAP side. An optional HTF (daily/weekly) alignment gate adds a 7th. Auto-profile detects your chart timeframe and tunes thresholds: 3m chart loads HMA 9/21 with looser ER (Day mode); 1H+ loads HMA 21/55 with tighter ER (Swing mode). Inline level badges (⚓ Anchor · ⚡ Flip · ★ Pain · ▲ Call Wall · ▼ Put Wall) and an embedded volume heatmap behind price keep your gamma layer always visible. Same-direction lockout suppresses signal clusters during chop. Built for 0DTE and weekly traders who want sniper-rifle entries, not flashlight signals.
Instant gamma-aware market regime intelligence. This clean overlay fuses institutional VWAP anchoring, real-time Volume Profile POC (your flip level), dealer Call/Put Walls, weekly Max Pain, and ATR-based Expected Move bands into one professional dashboard. At a glance it tells you exactly what regime we’re in — RANGE (dealers stabilizing), TREND (directional firepower), or CAUTION — plus whether dealers are net LONG γ or SHORT γ. Optional volume profile histogram, subtle background tint, and a fixed corner table keep your chart pristine while delivering the exact levels serious 0DTE and options flow traders watch every day. Full alert suite included. Built for traders who want edge without the clutter.
OPTIONSGAMMADEALER POSITIONINGALL TICKERS
LIVE CHARTSCLICK TO EXPAND
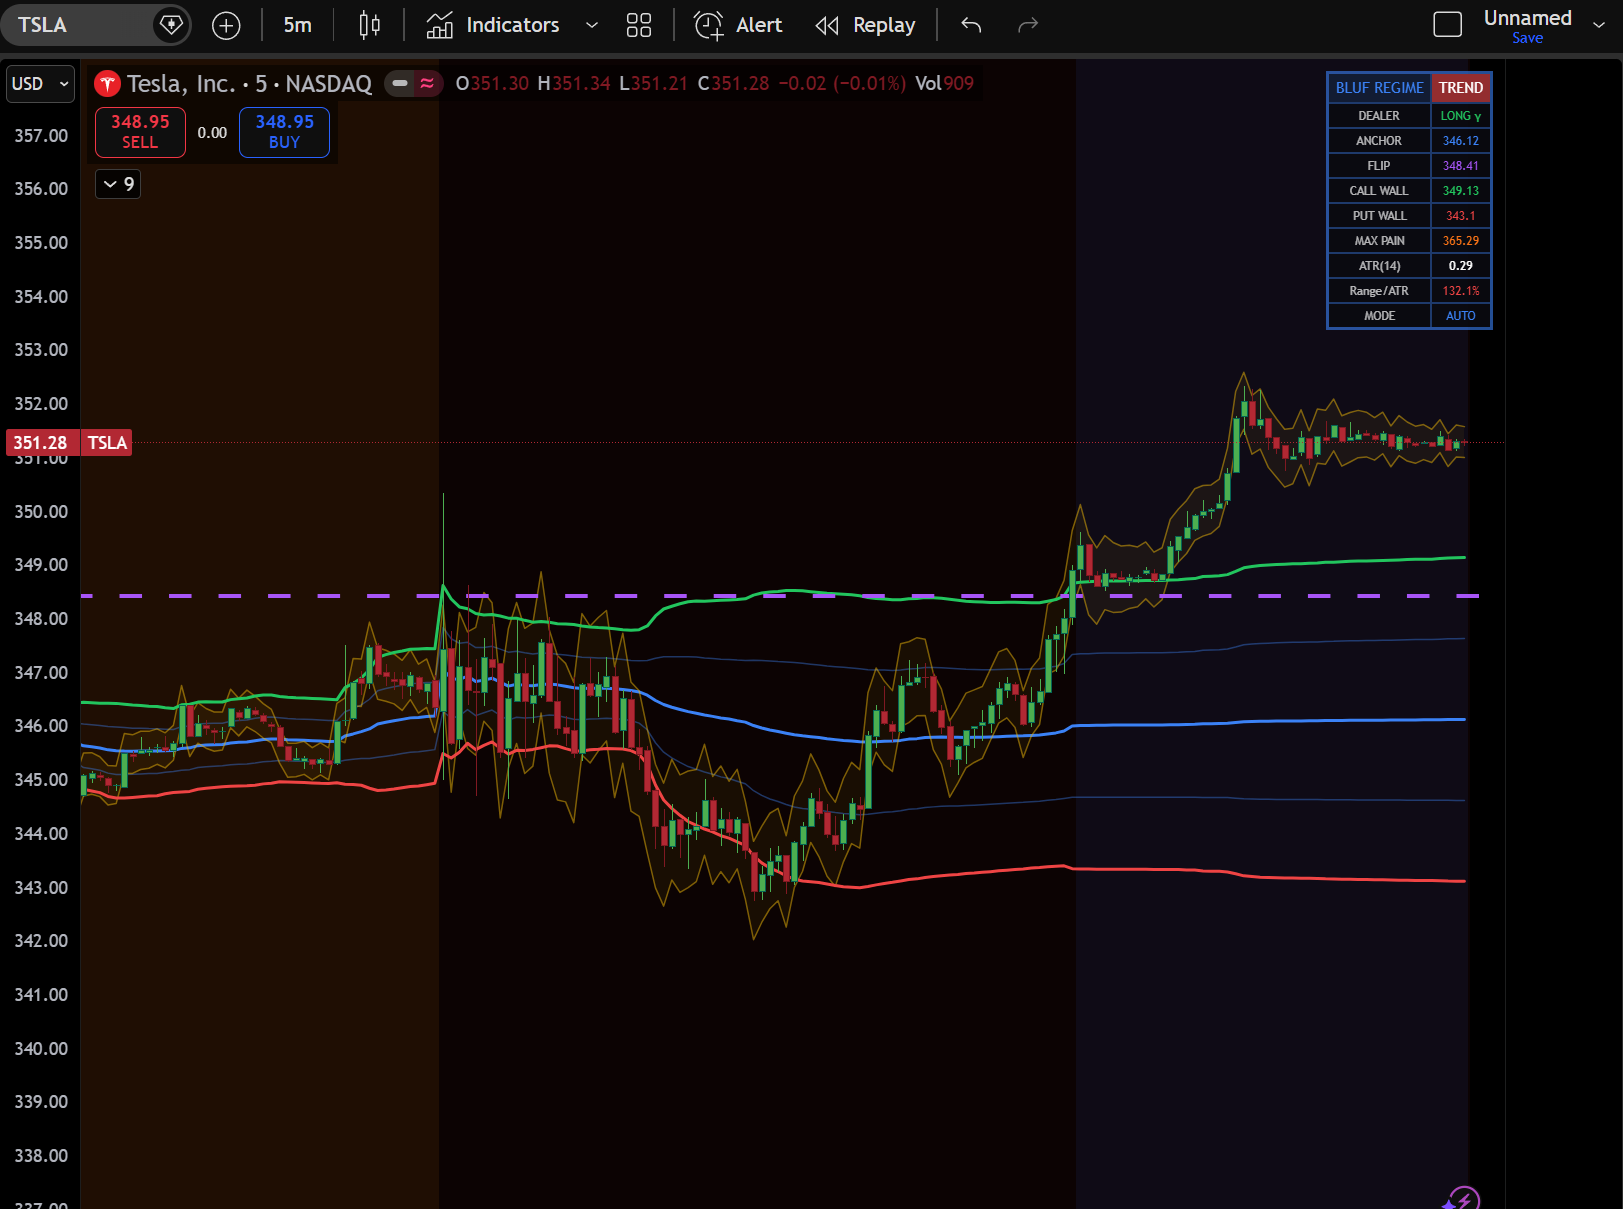
TSLA • 5m
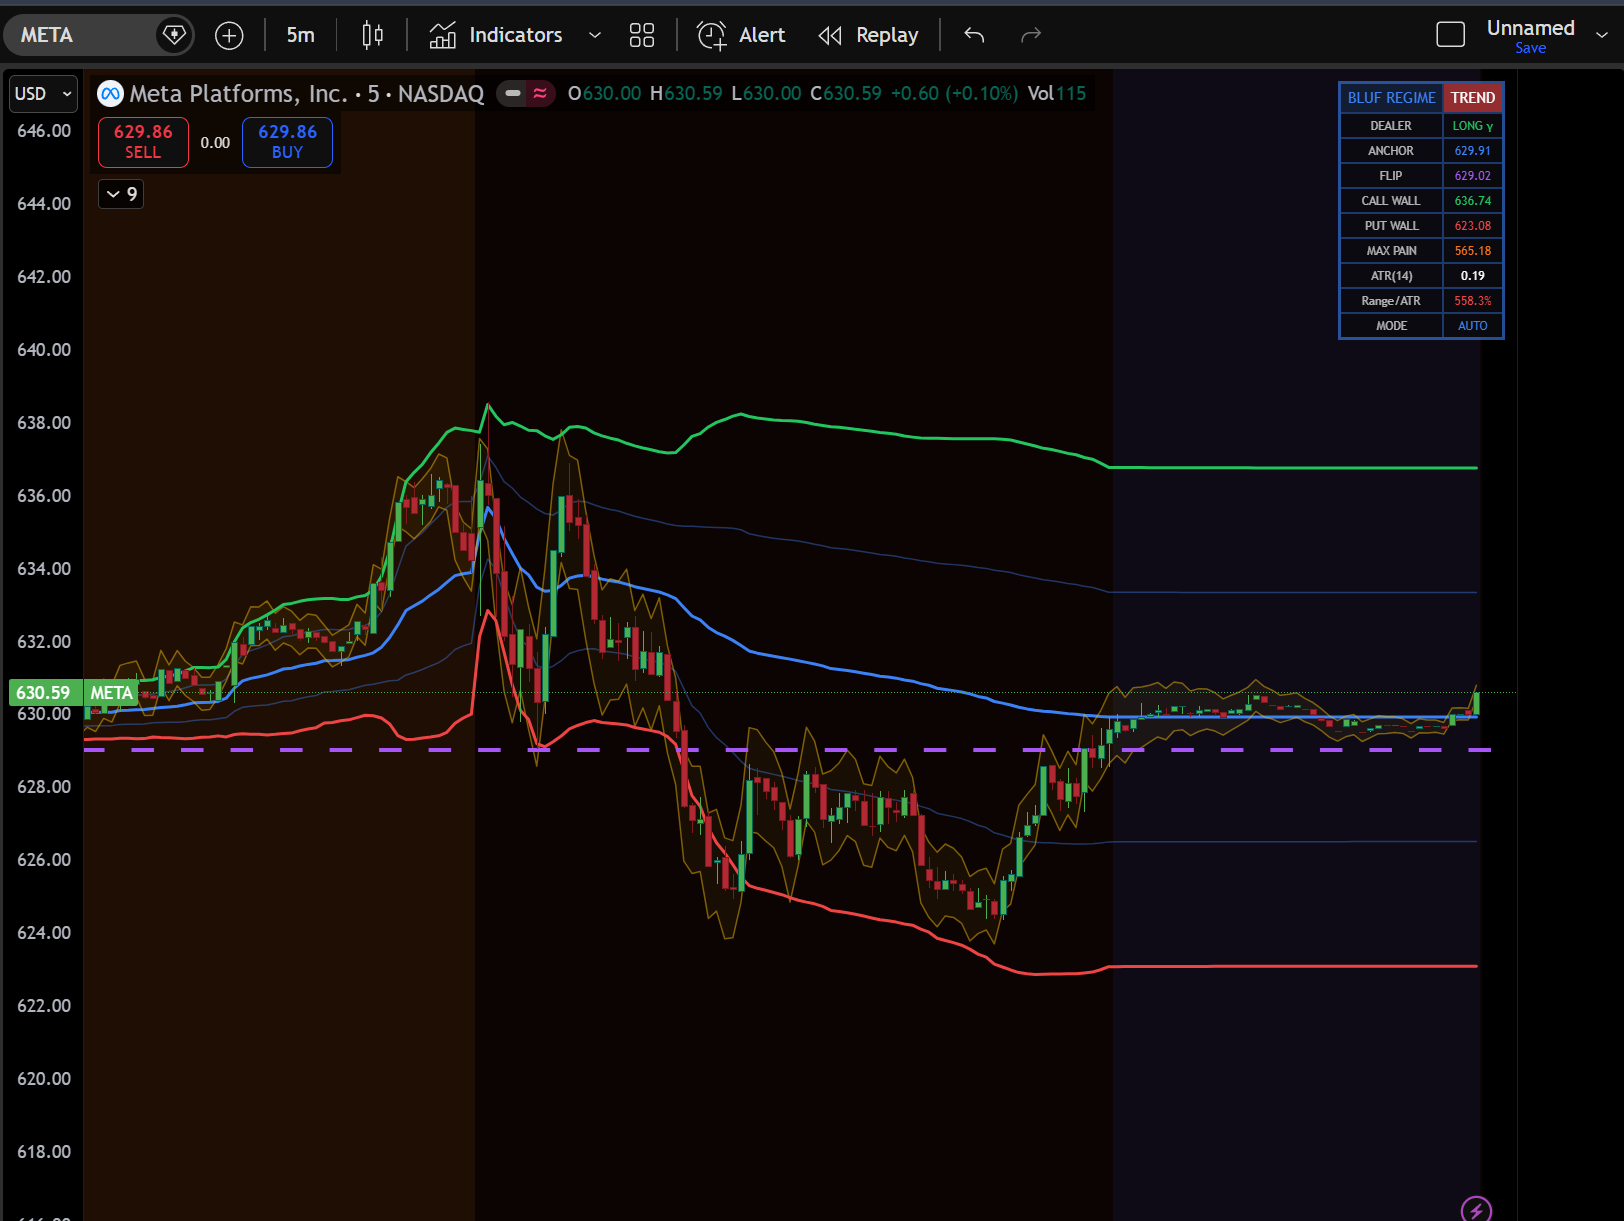
META • 5m
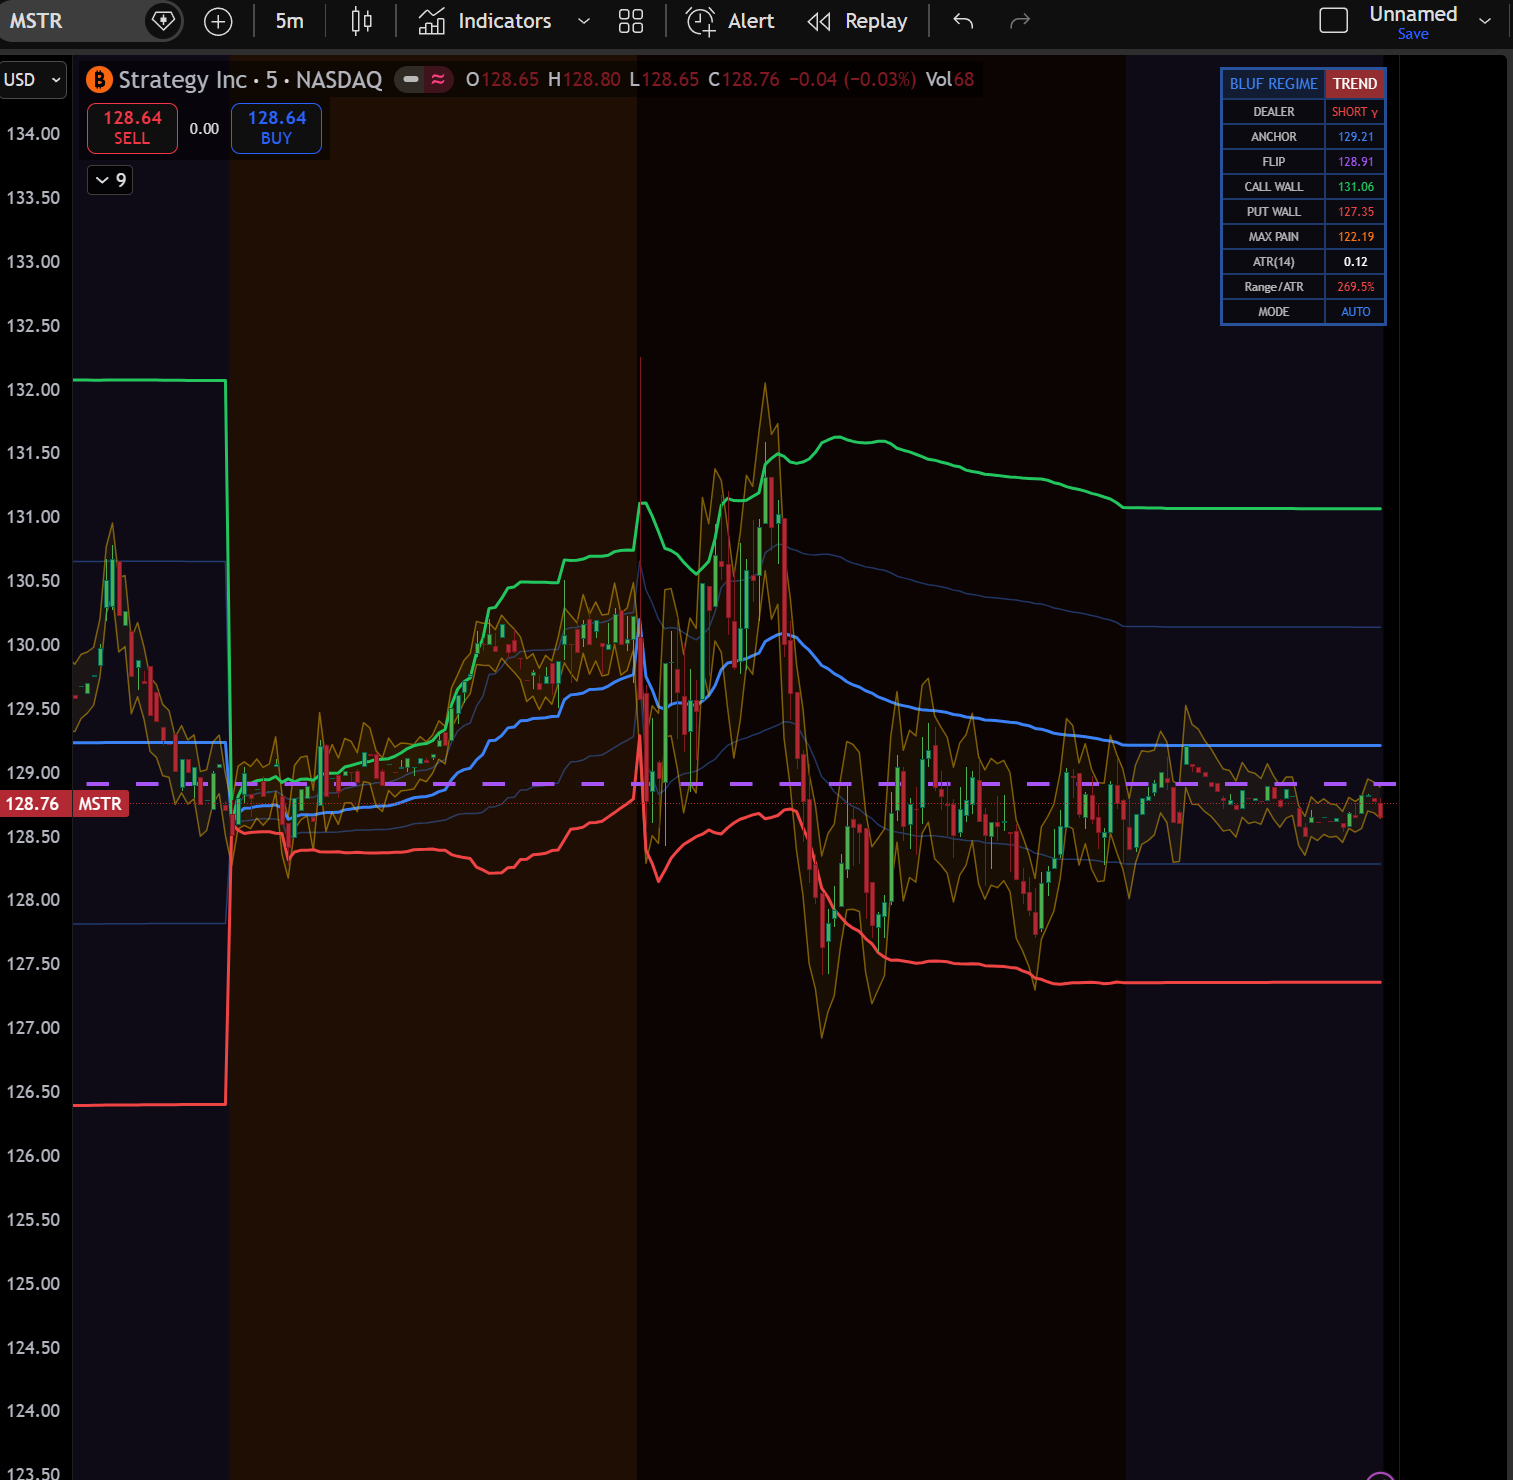
MSTR • 5m
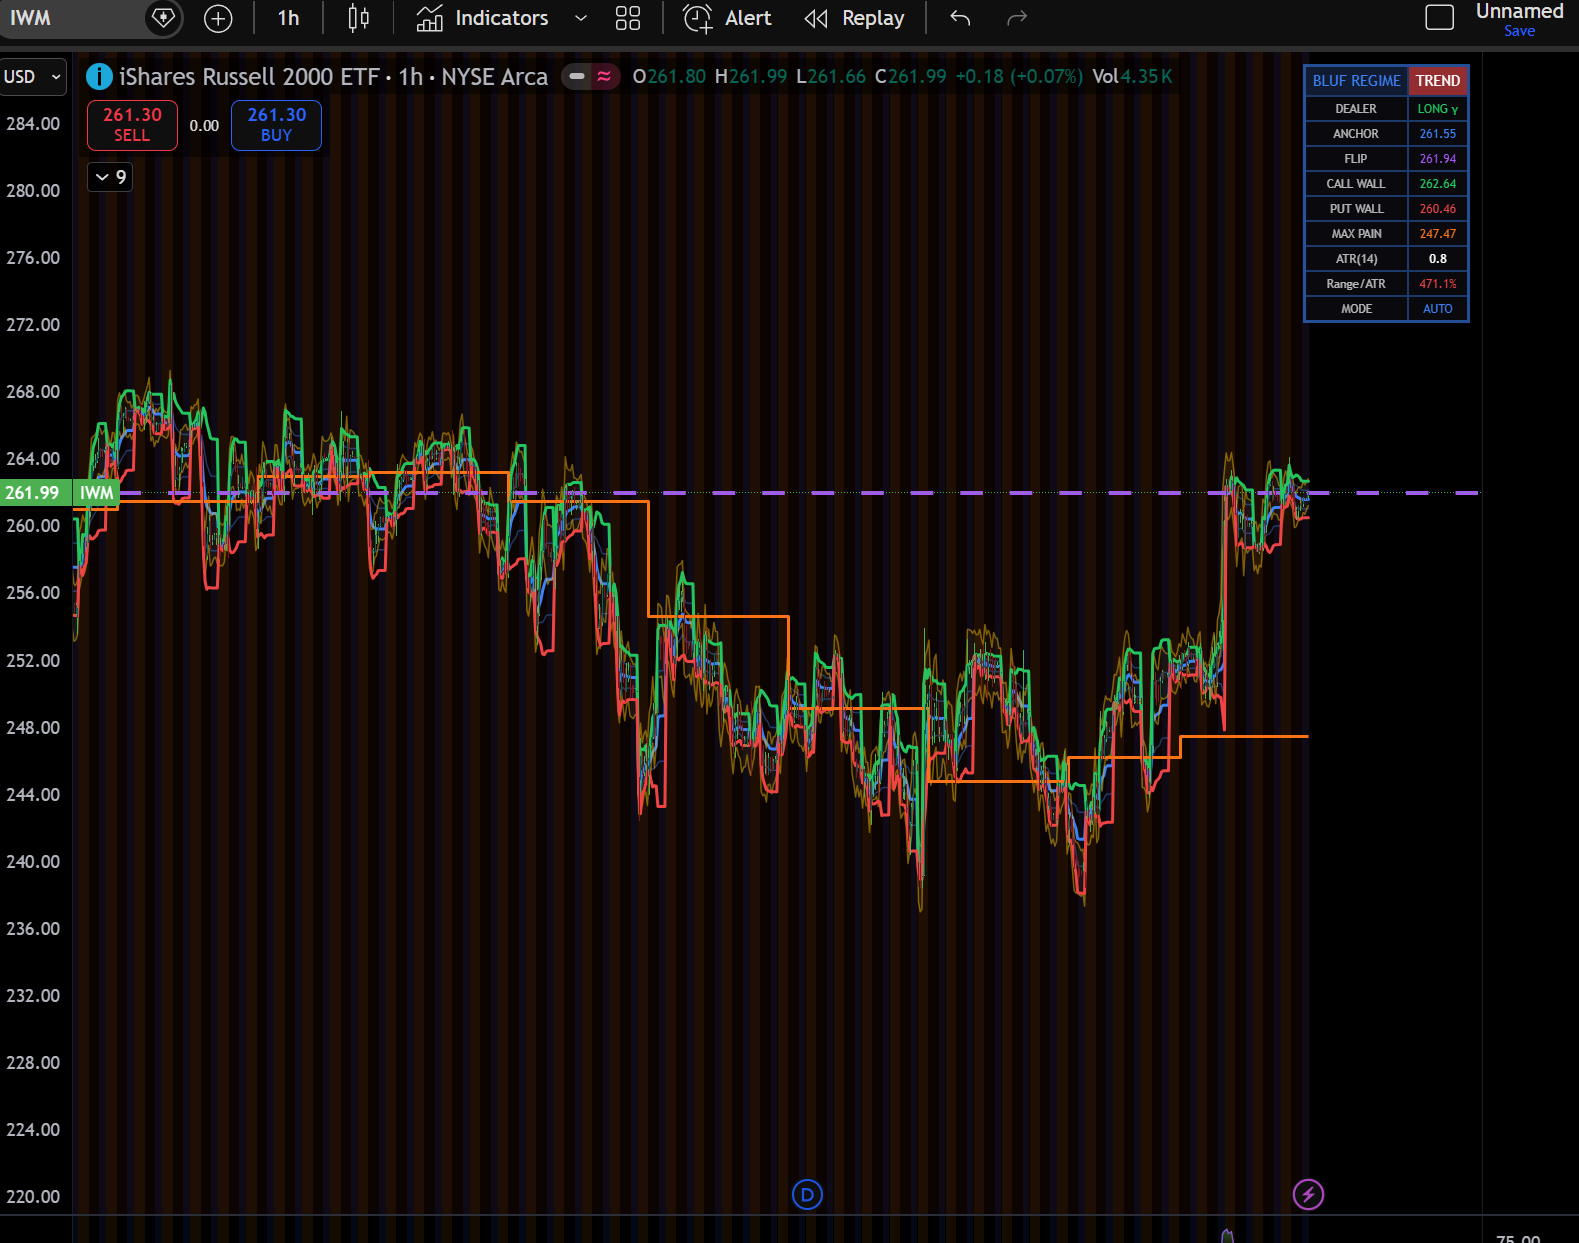
IWM • 1h
The levels do the talking. Anchor, flip, call wall, put wall — plotted in real time across any ticker, any timeframe. The IWM chart is on the 1-hour — same levels, same edge, even on higher timeframes.
TSLA ORB SIGNAL
Opening range breakout • Gap analysis • Directional bias • Entry/exit zones
Opening Range Breakout strategy optimized for TSLA with gap bias detection. Identifies the opening range, determines gap direction and strength, then plots entry zones, targets, and invalidation levels based on the gap-biased ORB framework.
DAY TRADINGTSLAORB STRATEGY
MORE INDICATORS COMING SOON — FOLLOW @BLUFTERMINAL ON TRADINGVIEW
HOW IT WORKSBLUF INTELLIGENCE ENGINE
Most gamma tools give you a static snapshot. BLUF runs a curated universe of tickers on autopilot, all day — the data on the home feed is already there before you arrive. Search any ticker for a fresh on-demand scan, but you don’t have to. Here’s how it works.
1
BLUF SWEEPS THE UNIVERSE
A curated set of tickers — the majors, semis, mega-tech, macro plays, crypto/fintech, and high-momentum names — is scanned automatically throughout the trading day. Open the home page and the scan feed is already populated with fresh gamma reads. You don’t have to type anything to see the data. If you want a ticker not in the sweep, the search bar still runs a live on-demand scan.
2
THE GEX ENGINE RUNS
On every scan — automatic sweep or your manual search — the engine pulls the full options chain (every strike, 0–10 DTE) and computes Gamma Exposure across the board to surface the anchor (primary magnet), flip level (where gamma turns negative), call wall, put wall, and max pain. Vanna Exposure (VEX) and Charm Exposure (CHEX) layer in second-order flow intelligence that most platforms don’t even calculate.
3
REGIME DETECTION
This is where BLUF separates from the pack. The engine determines whether dealers are net LONG γ (they dampen moves — sell rips, buy dips, mean-reversion rules) or SHORT γ (they amplify moves — trends run hard and fast). That single signal changes how every level on your chart should be traded.
4
FULL INTELLIGENCE DELIVERED
Interactive heatmaps, force fields, bubble maps, trade ideas with exact entries and exits, trigger levels, and a social-ready Shorts card — available the moment you load the page for any ticker in the sweep, or seconds after a fresh on-demand search. Charts that would take an analyst 30 minutes to build, rendered in real time.
5
EVERY SCAN FEEDS THE DATABASE
Every sweep tick and every on-demand search is written to the BLUF database — full chain data, computed levels, timestamps, regime state. That history is what powers the Intel Report’s back-tests, the scan timeline, and the algorithm scorecards. The scan feed on the home page is the universe sweep, running live, building the historical record in real time.
THE ALWAYS-ON EDGE
When the regime flips on SPY mid-afternoon, the sweep catches it — not when somebody happens to type SPY into the search bar. When the scan feed lights up with mega-tech before earnings, you know the engine has already done the work. BLUF isn’t a search tool that turns on when you do — it’s a market-hours intelligence engine that’s already running by the time you open the page.
WHAT ONE SEARCH GIVES YOU
■ GEX Heatmap — every strike’s gamma exposure visualized
■ Force Field — magnetic pull of key levels
■ Bubble Map — strike-by-strike gamma landscape
■ Trade Ideas — entries, exits, and risk levels
■ Trigger Levels — alerts for key price zones
■ Shorts Card — social-ready analysis in one tap
FREE. NO SIGN-UP. NO PAYWALL. JUST SEARCH.
PRODUCT ROADMAPWHAT'S LIVE & WHAT'S NEXT
LIVE — FREE ACCESS
✓ BLUF Terminal — live gamma scanner with anchor, flip, walls, and regime detection across major tickers
✓ TradingView Indicators — free published scripts: the BLUF Regime Signal (flagship), BLUF Regime Overlay, and TSLA ORB Signal
✓ Pre-Market Video Briefings — daily gamma analysis, regime calls, and key level breakdowns
✓ Discord Community — daily digest with key levels, thesis, and trade ideas
IN DEVELOPMENT
○ Accountability Tracking — historical level accuracy reports so you can verify our calls against actual price action
○ Expanded Social Coverage — bringing BLUF analysis to more platforms for broader accessibility
○ Automated Daily Briefings — AI-narrated pre-market videos delivered consistently before the opening bell
○ Weekly Newsletter — curated gamma intelligence digest with macro context and trade setups
○ Index-Level Analysis (NDX, RUT) — direct index gamma scanning with proper options chain integration
COMING SOON — PREMIUM
○ Premium Terminal — real-time data, full ticker coverage, custom alerts, and institutional-grade trade ideas
○ Mobile Alerts — push notifications for regime changes, gamma flips, and unusual activity
○ 24/7 Infrastructure — dedicated servers for faster scans and always-on monitoring
○ Advanced Analytics — vanna exposure, charm decay overlays, and IV skew surface visualization
SUBSCRIBE TO THE NEWSLETTER OR JOIN DISCORD TO STAY INFORMED ON NEW RELEASES
SUBSCRIBE & SUPPORT
⚡ Free Newsletter
Daily options intelligence delivered to your inbox. Gamma levels, dealer positioning, trade ideas.
Support BLUF
BLUF Terminal is free and always will be. Server costs, data feeds & API access run ~$200/mo.
✓ Real-time gamma heatmaps & force fields ✓ Multi-ticker portfolio scanner ▸ Options flow alerts & unusual activity ▸ Premium dashboards & API access ▸ Mobile app (coming soon)
DEALER FLOW READING
ENTER A TICKER ABOVE TO SEE DEALER FLOW
GEX / VEX / CHEX Bubble Map
Bubble Map
Multi-expiry GEX, VEX, and CHEX visualized as interactive bubbles. Size = magnitude, color = call vs put gamma. Click any bubble for strike-level intel.
Enter a ticker above and hit ANALYZE to load this section
Multi-Expiry Gamma Heatmap
Anchor ⚓
—
Max positive GEX
Flip ⚡
—
Zero-cross level
Max Pain 🎯
—
Options gravity
Bias
—
ATM net GEX
Green = Long Gamma · Red = Short Gamma · AGG = aggregate across all expiries
Gamma Heatmap
Strike-by-expiry GEX matrix with color-coded intensity. Green = dealer support, red = dealer resistance. Anchor, flip, and max pain levels highlighted.
Enter a ticker above and hit ANALYZE to load this section
Command Center
⚠️DEVELOPMENT TRAINING GROUND
Scan values, regime signals, and level calculations are under active development. Formulas are being calibrated against live data — accuracy improves with every scan cycle. Treat outputs as experimental intelligence, not financial advice.
Top Scanned Tickers
Loading...
Command Center
—
Accountability Scorecard· graded after 3 trading days · ≥1% move = win
• LAST 25 TICKERS
—
No scanned tickers yet. Hit Populate or scan a ticker above.
Speed Zones = where the GEX gradient is steepest — accelerated moves.
Volatility Band (blue) = 1-week expected move (68% probability).
Force Field Logic: Bright = dealer hedging absorbs vol. Dark = dealers amplify moves.
Force Field
Aggregate gamma positioning landscape across all strikes. Click any bar for strike-level intel, dealer positioning, and speed zone analysis.
Enter a ticker above and hit ANALYZE to load this section
🚨 Unusual Options Flow
All Quiet
No unusual options activity detected. This scanner triggers on anomalous volume/OI ratios and elevated IV premiums — rare by design. When it fires, pay attention.